Find your product
Advanced searchLogin
Webshop under construction
Due to technical maintenance the webshop is closed until January 3, 4. We wish you a successful 2025!
Welcome
Sign outPersonal information
NEBNext Direct® Custom Ready Panel technology analyzed using NextGENe®
Kevin LeVan1, Cynthia Hendrickson2, Andrew Barry3, Bjoern Textor3, Paul Jeffrey4, Kim De Leeneer5
1. SoftGenetics, State College, PA USA. 2. Directed Genomics, Ipswich, MA USA. 3. New England Biolabs, Ipswich, MA USA. 4. BIOKÉ, The Netherlands 5. Ghent University Hospital, Belgium.

Introduction
With targeted panels becoming an excellent alternative for whole exome and genome Next Generation Sequencing (NGS) there is an increasing need for highly flexible and optimized custom panels. The NEBNext Direct® technology, offered by New England BioLabs® Inc. in conjunction with the NextGENe® software from SoftGenetics represents a high-quality solution for generation and analysis of sequencing data for identification sequence variants present in a user-friendly manner. NEBNext utilizes Unique Molecular Identifiers (UMIs), allowing for the detection of PCR duplicates, and NextGENe Biologist-friendly (non-scripting) software is capable of removing these duplicates, increasing the allele frequency accuracy. This application note describes the NEBNext Direct technology in a first line screening for familial cancer patients for Ghent University Hospital. For this screening a 60 gene NEBNext Direct Custom Ready Panel was designed including high and moderate risk cancer related Breast, Ovarian, Colon, Pancreatic, Melanoma and Fanconi anemia coding regions.
"The NEBNext Direct technology enables us to work with larger panels with reduced sample input"
Dr. Kim De Leeneer, Lab supervisor, Center for Medical Genetics, Ghent University Hospital
Method
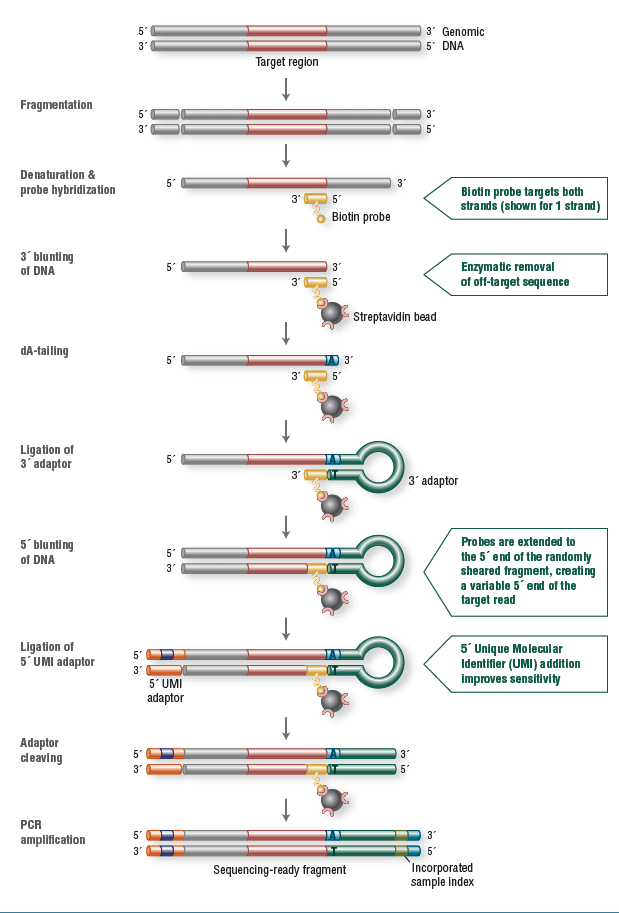
For this study 12 samples were used consisting of 9 gDNA, extracted from blood and 3 FFPE-derived samples. NEBNext Direct libraries were created by shearing 100ng DNA to a median size of 200bp using Covaris ultrafocused acoustic shearing. DNA was denatured and hybridization was carried out using biotinylated oligonucleotide baits specific to the NEBNext Custom Ready Panel. Captured DNA was bound to streptavidin beads and separated from unbound material. Enzymatic removal of off-target sequence was performed, followed by a series of enzymatic manipulations to convert the captured material into Illumina sequencer compatible libraries. The resulting libraries contain two index barcodes incorporated into the universal adaptors. The 3’ adaptor contains an 8 bp, sample-specific index used to disambiguate samples pooled prior to sequencing. The 5’ adaptor contains a 12 bp randomized sequence that serves as a UMI, tagging individual molecules allowing marking of duplicates created during PCR amplification (Figure 1). Prepared libraries were sequenced on an Illumina MiSeq using 2x150 bp paired-end v2 chemistry.

Figure 1: NEBNext Direct chemistry
Results
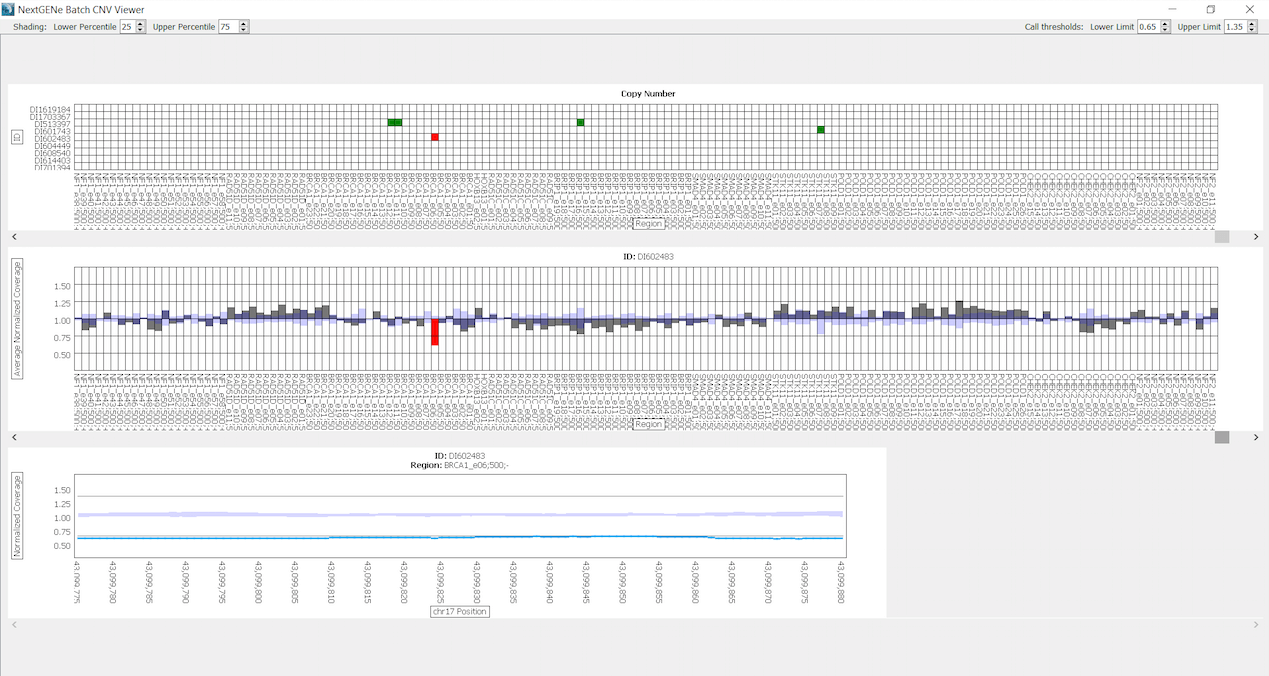
All 12 samples show an Illumina Q-score > 30. For the data analysis a custom NextGENe NEBNext Direct Template was created to specify all settings for the analysis. The Template automatically guides the sample through a series of steps, including Removal of PCR duplicates, Format Conversion, Trimming of adapters, Alignment to the human genome and Variant calling. As Human Genome reference Human_GRCh38.p7 was used at 1% allelic frequency cut-off. All samples show a 50x coverage for over 99% of the bases. After processing, the projects can be visualized in the NextGENe Viewer, multiple reports and charts are available including the Batch CNV Tool for Copy Number Variation (CNV). This tool is validated for clinical applications and compares multiple samples to one other. It has been shown to be concordant with a Sanger/MLPA®combo approach [1]. In Figure 2 CNV from gDNA sample D1602483 are shown compared to the 8 other gDNA samples. Green blocks indicate regions with ratio greater than 1.35 and red blocks indicate regions with ratio less than 0.65. This tool identifies a complete deletion (105bp) of BRCA1 exon 6 for sample DI602483.

Figure 2: Batch CNV Viewer showing copy numbers for sample DI602483 compared to a batch of the other 8 gDNA samples. Green blocks indicate regions with ratio greater than 1.35 and red blocks indicate regions with ratio less than 0.65. The top chart shows all regions of all samples, the middle chart shows the ratios of each region in sample DI602483 and the bottom chart shows the ratio of each base for BRCA1 exon 6 region.
In summary, this study shows that the NEBNext Direct chemistry in conjunction with the NextGENe software offers a highly flexible, optimizable and user-friendly solution for the use in targeted NGS applications.
References
[1] Schenkel, Laila C., et al. Clinical Next-Generation Sequencing Pipeline Outperforms a Combined Approach Using Sanger Sequencing and Multiplex Ligation-Dependent Probe Amplifi cation in Targeted Gene Panel Analysis. The Journal of Molecular Diag-nostics. 2016, 18(5), 657-667.
Products
NextGENe NGS data analysis software
Learn more about these technologies